Personal Dashboard
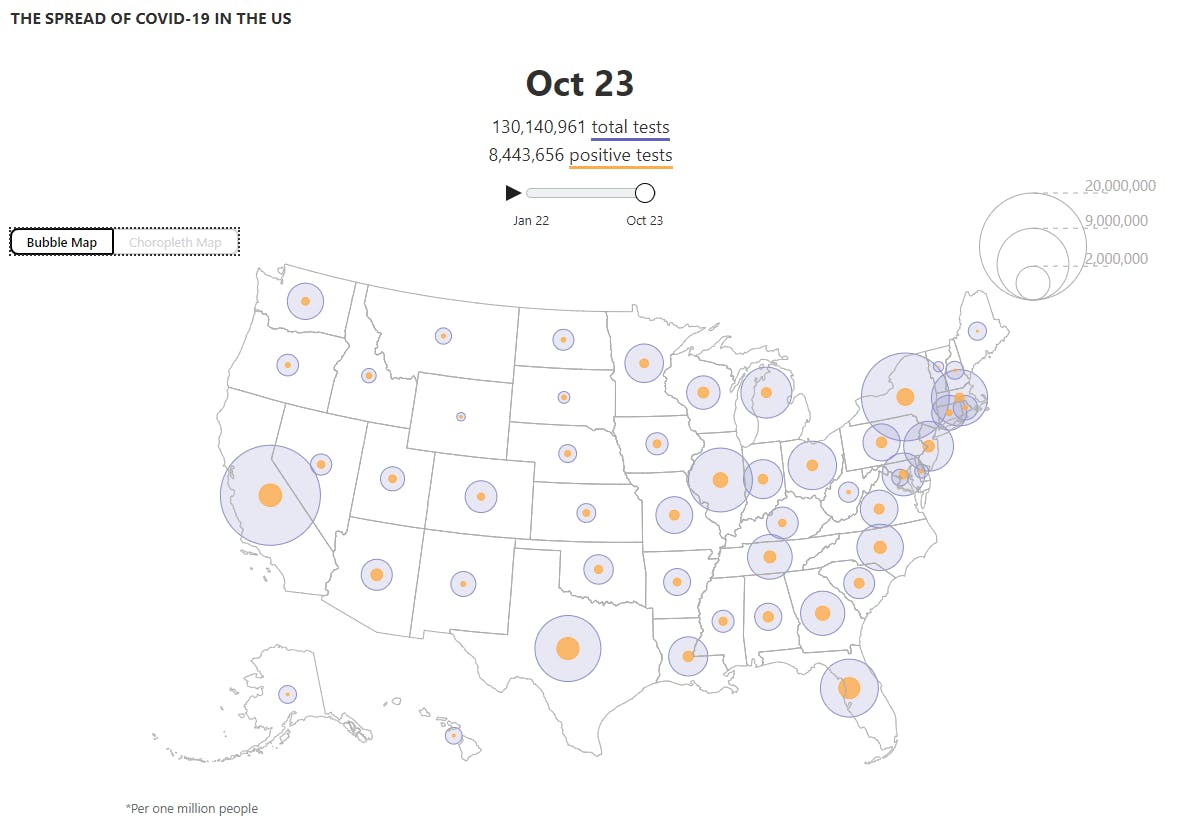
I was looking for ways to apply my skillset to the growing COVID19 problem in March of 2020. The most useful dataset I could find at the time was from The COVID Tracking Project because they not only provided case counts but also test numbers.
100 cases/day with 100 tests/day in one state is VERY different than 100 cases/day with 1,000 tests/day in another state.
I built my dashboard using:
The COVID Tracking Project
Through Twitter my dashboard was noticed by one of the founders of The COVID Tracking Project and I was recruited to join an effort to help step up data visualization on their official website.
- Helped create a Visualization Guide with example graphics & tips on how to clearly & accurately portray the data
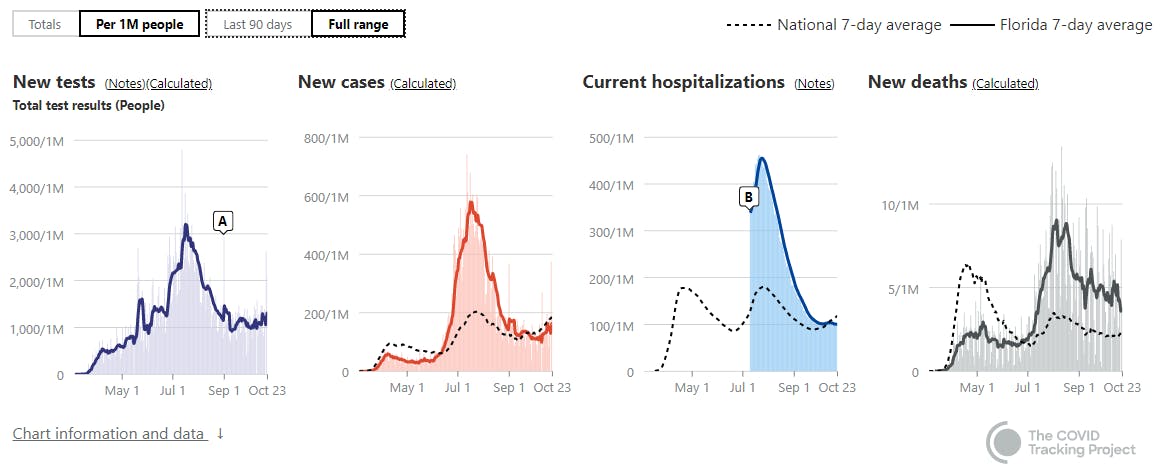
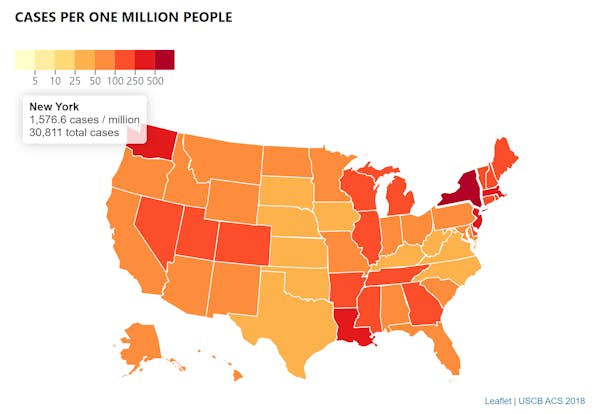
- I built custom D3 chart components to display our data at a National & State level and are viewed thousdands of times every day and have been Tweet by Nate Silver
- Created a framework for building Scrollytelling experiences on the website.
Technologies used